
Diasporan Consumption
as a Spur to Armenia’s Economic Growth*
Executive Summary
Diaspora Consumption (pdf version)
Diasporan Armenians often wonder how they can best help to grow the economy, create jobs and achieve prosperity in Armenia:
- investment
- remittances
- charity
- tourism
- volunteering
- studying in Armenia
- public works projects
- buying Armenian products and services
While each of these may spur economic expansion, some deliver more “bang for the buck” than others; that is, some economic infusions cause greater and more immediate economic expansion because they have a higher multiplier effect on the economy.
This study explores why “investing” in selected non-tourist Diasporan programs and promoting diasporan export consumption in Armenia are among the most effective ways to spur Armenia’s economic growth. An earlier independent study of the Armenian Volunteer Corps (AVC), a program that sponsors and provides public and private placements for Diasporan volunteers in Armenia, showed that each dollar spent on a volunteer produces nearly US$4 of hard spending and economic expansion in Armenia within one year.[1] The multiplier effect identified in this study is a composite of the standard money supply multiplier and the catalytic effect of volunteers on Diaspora-homeland trust and insight into opportunities in Armenia, gained through the volunteer process. The focus of that study is economic benefits. However, for both the Diaspora and homeland, the intangible benefits, although more difficult to quantify, are similarly impressive: an enriched sense of Armenian identity, awareness of economic opportunities and trends in Armenia, and knowledge transfer and networking essential for global competitiveness.
This study shows an impressive and immediate economic impact of non-tourist Diasporan programs and export consumption. Multipliers and returns on investment are typically substantially lower and slower. For example, the multiplier on bank savings in the US is 10,[2] which are substantially higher than the Armenian Central Bank estimate of 3 for Armenia, because of the higher business risk and more stringent lending policies prevalent in Armenia. The World Bank estimates the multiplier for commercial exports from Armenia at two[3] – that is, each dollar of exported goods results in 2 dollars of growth in Armenia’s economy.
Economic growth is not an end in itself: it usually translates into jobs and an improved standard of living. Based on 2002-2003 statistics, 1% growth in GDP yields approximately 0.1% job growth, or 1000 jobs with an average monthly salary range of $50-100.[4] The job creation effect of economic growth in Armenia is dampened by the fact that many Armenians are currently under-employed, so that increased demand is satisfied first by increased productivity of current job-holders and only later by new hires.
While any exogenous cash stream into Armenia (remittances, tourism, investment, charity, export revenues) leads to an expansion of the money supply, how this new cash is used and re-used downstream in Armenia’s economy can make a significant difference in its multiplier effect on the economy. For example, a larger portion of a dollar earned by a non-tourist diasporan’s host family in a village stays in the local economy than that of a dollar paid to a company for lodging, which may be spent on purchasing imported goods.
Thus, consumption patterns also play an important role and carry over to post-visit consumption, increasing Diasporan demand for Armenian exports within a stable and loyal market, in turn generating a sustainable expansion of Armenia’s economy, estimated conservatively at 10% of GDP, while creating 8,000 to 10,000 jobs.
This study analyzes the composition and impact of non-tourist global Armenian Diasporan consumption in a comparative perspective and looks at the follow-on impact of increasing Diasporan demand for a range of Armenian exports.
- Armenia and the Diaspora: A Quick Economic Overview
Over the last several years, Armenia has made impressive progress in establishing a framework for structural reforms in its economy. Despite external shocks, macroeconomic conditions have remained quite stable, with relatively low inflation and a steady exchange rate, a sufficient level of international reserves, and considerably reduced budget deficits.
-
- Some Vital Statistics
Armenia has a population of approximately 3 million and a GDP of $2.5 billion, which means that the average Armenian lives on approximately $3 per day. Total international assistance to Armenia since 1988 (including earthquake and blockade relief) was $1.8 billion, which is approximately 15.5 cents per person per day, assuming that on average 75% of aid stays in Armenia in some form (salaries, foreign workers’ living expenses, locally sourced goods and services). About 7-8% of Armenia’s GDP is composed of remittances, mostly from immediate family members in Russia and, to a lesser degree in the US, amounting on average to approximately $15 million per month. Armenia imports most durables (automobiles, appliances, electronics) and certain key commodities (natural gas, gasoline and some sugar and flour). Since Armenia has a low investment and savings rate, GDP is a rough gauge of aggregate consumer power. The wage base is approximately $80 million.[5] The workforce in Armenia is 1.4 million (approximately 40% of the population), of which 800,000 are employed, and of the employed, 250,000 are on the Government payroll (including military personnel, teachers, most doctors, and the rest of the bureaucracy). The average salary, according to 2002 World Bank statistics, is approximately $60-100 per month. Of the remaining 550,000 in the private sector, 250,000 are self-employed in subsistence farming and 300,000 have titular jobs, although many are in reality, under- or un-employed.
The Armenian Diaspora’s economic situation is hard to assess for lack of targeted data, but based on various official and unofficial estimates, the total population of the diaspora is approximately 7 million, with the 4 largest concentrations being in Russia, the US, the Middle East and Europe.
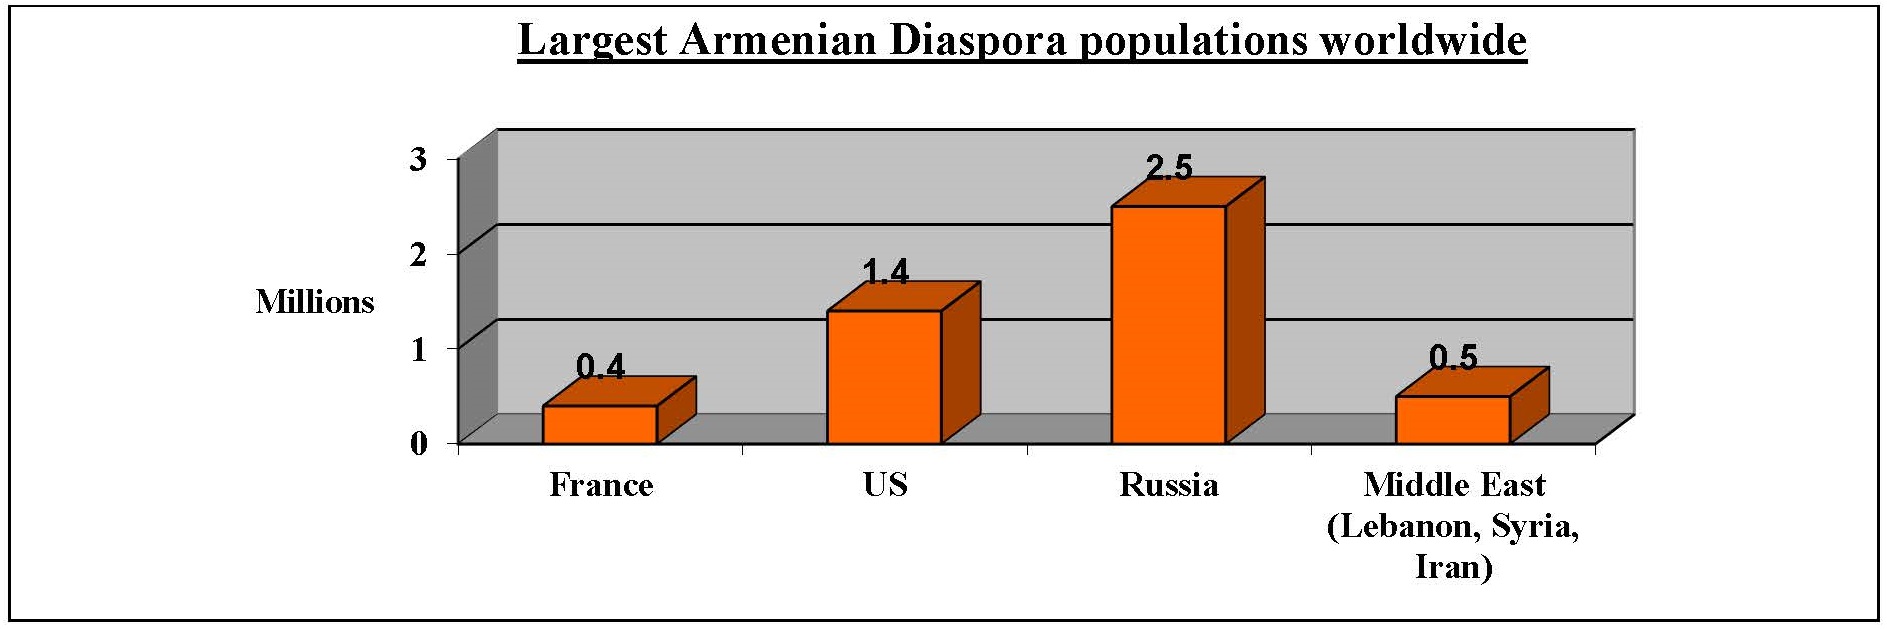
Source: RA Ministry of Foreign Affairs (2003)
This study focuses on the US and Russian Diasporas, which together constitute more than 70% of the Armenian Diasporan population worldwide and a roughly equivalent proportion of aggregate Armenian Diasporan wealth and purchasing power. The purchasing power of the US diaspora is approximately $21.85 bln.,[6] while the purchasing power of the Russian Diaspora is approximately $4.4 bln. The aggregate net wealth of US Diaspora households is over $175 bln.[7]
-
- Armenia’s Economy since Independence
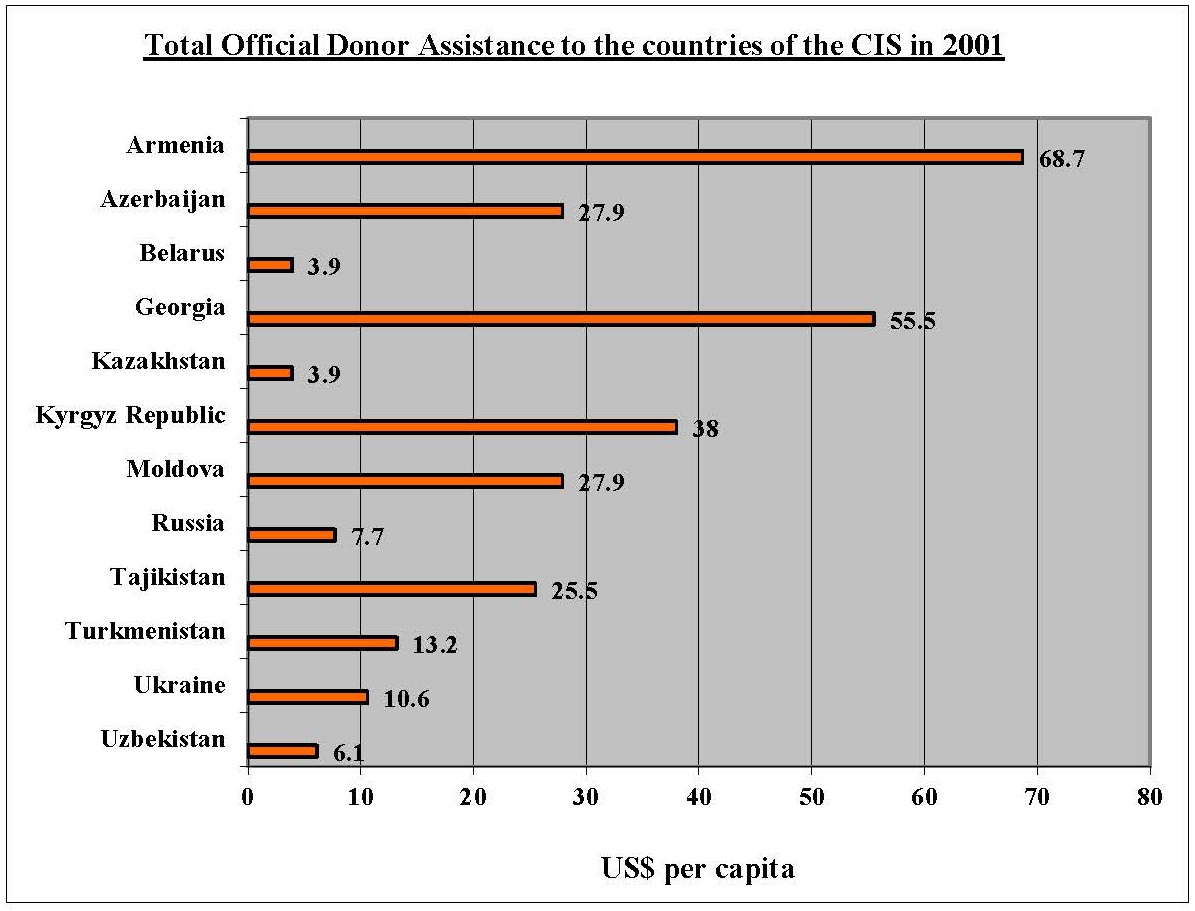
Armenia’s economic performance is still significantly below its 1989 level of aggregate socio-economic indicators. The country lacks natural resources and is landlocked. Its institutions are underdeveloped and income levels low (about two thirds of the average CIS level). One of its chief assets, high quality human capital, is being rapidly depleted due to brain drain and lack of investment. Nevertheless, starting from a small base, Armenia’s growth performance has been strong compared to the rest of the CIS. After a drastic 60% decline in the beginning of the 90’s, the country started to grow, averaging 7% annually. Factors contributing to this growth include reconstituting the electric system, increasing external private transfers (remittances) that pushed domestic demand, and international assistance making Armenia a leading regional recipient of donor funding in per capita terms.
-
- In-Flows from Diaspora and International Donors
On average donors provided about $120 million annually, around 5% of GDP (in total, donors have injected around $1.8 billion into the Armenian economy since the early 1990’s). The other main source of assistance came from the Armenian Diaspora. Diasporan financial transfers to Armenia have amounted to nearly $175 million annually, accounting for about 7-8% of GDP in recent years (the aggregate figure for Diasporan transfers since independence is around $1.2 billion). Among CIS members, Armenia ranks highest per capita in terms of Diasporan financial transfers[8] and in terms of international assistance transfers.
| Remittances in Context: In 2002, according to RA Central Bank Statistics, bank transfers to Armenian individuals alone comprised around $460mln., some of which can be characterized as remittances and some of which is repayment of loans or payment for goods and services.
In 2002, worldwide, émigrés sent home more than $100 billion. The deregulation of international financial markets coupled with new technologies has made sending money back home easier and cheaper than ever. Worker remittances account for 24 percent of Nicaragua’s gross domestic product, 19.6 percent of India’s, and 6.5 percent of Morocco’s. In Mexico, remittances are the third largest source of foreign exchange after oil exports and tourism. And in Turkey, they are four times larger than the country’s inflows of foreign direct investment. In most developing countries, remittances far exceed the amount of funds received through official development assistance or foreign portfolio investment. |
Source: World Bank Country Data (2003)
-
- Globally Competitive Economy
For Armenia, like any country, the key to development is a robust, globally competitive private sector that satisfies certain basic domestic needs and provides exports to the world. While this is primarily a private sector function, the public sector has an essential role to play. The private sector creates wealth by producing globally competitive goods and services, while the public sector fosters a globally competitive private sector by creating a globally competitive environment that enables the private sector to compete successfully. Each must do what it does well and perform its functions in a globally competitive manner. If a company is not competitive, it loses money and market share, and eventually goes bankrupt. If a country is not competitive, it loses businesses, jobs and workers, and eventually becomes poor. Until Armenia becomes an attractive environment that encourages the private sector to win in global competition, Armenia and its citizens will lose out to other countries that do a better job of supporting their private sector companies. The goal should be not simply to bring the legal system and business environment up to international standards, but rather to make Armenia’s legal system and business environment more attractive than those of its competitors. However, change comes more slowly than many investors would like, so they often look for “greener pastures.” Nevertheless, many public and private sector leaders in Armenia understand that good laws properly administered are the best service they can render the country and are working toward that goal.
While certain impediments are difficult to overcome – e.g., being a land-locked country in a somewhat unfriendly and poor neighborhood – most of the components of a globally competitive environment are largely in Armenia’s control, e.g., policy, law and institutions. Good laws and policies properly administered are pre-requisites to creating a globally competitive environment. They require good ideas, good will and public resources. Good laws and policies are those that the state can administer well. Government should only do what it can do well with the resources it has. In other words, assuming that Armenia’s GNP will reach $3 billion in the next couple of years and that it is reasonable to collect 30% in taxes, then at a maximum, Armenia will have a $1 billion budget for public services and administration. Armenia should set priorities and do only what it can do well and what is absolutely essential within that budget of $1 billion. Otherwise corruption and inefficiency will make the environment less attractive than in other countries. One of the purposes of this paper is to explore how to increase resources to a level that will permit the creation of the necessary environment for prosperity.
-
- Investment: Small Piece of a Small Pie
According to the World Investment Report 2003 recently published by the UN, 80% of the total $1.4 trillion global FDI (foreign direct investment) flows in 2000 took place between developed countries (North America, EU, Japan) while about 15-18% of FDI went to developing resource-abundant countries (Middle East, Russia, China, India etc.). In short, 50-60 relatively prosperous or resource-rich countries are the overwhelming beneficiaries of FDI in a graphic example of the “those who have shall get” phenomenon.
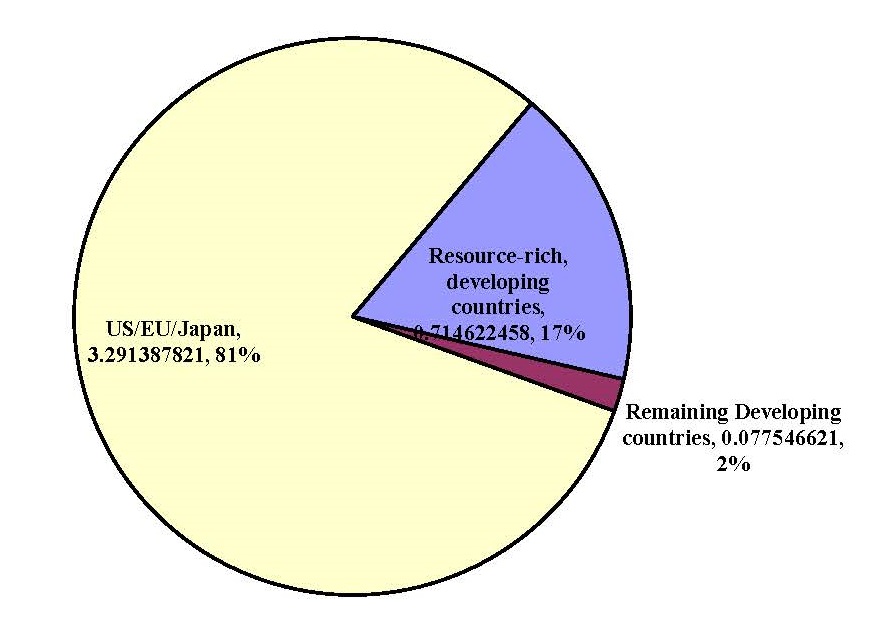
Source: United Nations Committee on Trade and Development (2003)
The residual 2% of total FDI is thinly spread across the rest of the “have not” world that accounts for more than 150 countries, among which Armenia ranks fairly low in absolute FDI and mid-range for FDI per capita. All things being equal, Armenia is competing with these 150 countries for a piece of a very small pie.
According to some analysts, thanks to its well-established Diaspora, Armenia may stand out in the pack in global competition for investment.[9] Alec Gevorkyan and David Grigorian in their working paper “Armenia and its Diaspora: Is There a Scope for a Stronger Economic Link?” urge creation of specific mechanisms for “attracting more investments (both private and public)” from the Diaspora.[10]
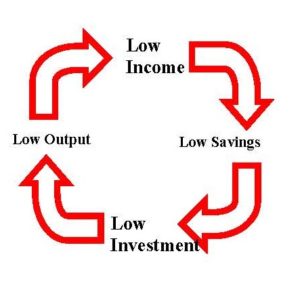 They describe the current situation as a “vicious circle” with little chance of escape, “[u]nless external resources are called upon, an economy which produces less and, therefore, saves less, is bound to remain poor, because it has few resources to grow further.”[11] According to them, the way out of this vicious circle is to attract Diasporan investment and break the link between Low Savings and Low Investments. The models they propose include the establishment of investment/equity funds, creation of Pan-Armenian banks or introduction of sovereign “Diaspora” bonds. Such intermediating institutions require levels of trust and investment which to date have not materialized.
A major impediment to their proposed solution is Diasporan lack of trust towards Armenian state institutions. For many potential investors, their frustrated attempts to make investments or reports of others’ failed investment attempts in the mid-nineties still loom large. Many Diasporans believe that the investment environment is not supportive or encouraging and often consider it obstructionist, predatory and/or hostile. To overcome this attitude the country must improve its public relations and outreach to the Diaspora, while taking real steps to improve local institutions and create a globally competitive domestic environment for investment.
Increased interaction with non-tourist Diasporans is key to changing these attitudes, transferring knowledge and expertise, building networks, improving understanding and integrating into global markets. Profit-motivated institutions such as investment banks, mutual funds, consulting firms and other financial intermediaries usually help to bridge this gap. But for now, Armenia, because of its size and stiff international competition for such professionals and services, is underserved by these institutions. Furthermore, it is hard to predict when Armenia will be on their agenda. Nevertheless, Armenia needs to bridge this gap as soon as possible.
Thus, at least in the short run it may be prudent to diversify the economic development effort and reduce reliance on foreign direct investment. Of the five primary Diasporan cash flows to Armenia – foreign direct investment, indirect investment, remittances/charity, directing third-party contracts to Armenia, and consumption – foreign direct investment is the most risky, time consuming and resource intensive. Indirect investment requires less time, but is not possible without intermediating institutions that do not exist yet and will take time and resources to create. Remittances and charity may help drive local demand, but much of this may cycle right out of Armenia in the form of basic commodity imports, such as gasoline, gas, flour, sugar, appliances, and clothing. Remittances and charity may also create dependency and may not be sustainable as “family donor fatigue” sets in.
In contrast, consumption of Armenian products and services keeps money in the country. Diasporan consumer spending, whether in-country or on exports, is a direct injection of new capital into the system. Unlike remittances and charity, consumption puts people to work and does not foster a handout mentality. And in comparison, to investment, consumption is faster, has fewer institutional prerequisites, and poses less risk and hassle. Consumers see the product or service: they like it, they buy it. Given that most Diasporans have little or no experience as direct foreign investors, but like all people have a lot of experience as consumers, consumption deserves a closer look. In particular, the consumption patterns of non-tourist Diasporans is well suited to spur the development of Armenia’s economy.
| Context. Surveys show that about 10 percent of Hispanic immigrants in the United States also trade with their home countries. In fact, the engagement of immigrants in international trade can have a significant economic impact. As James E. Rauch writes in the December 2001 Journal of Economic Literature, over time “a 10 percent increase in immigrants to the United States will increase U.S. exports to the country of origin by 4.7 percent and U.S. imports from the country of origin by 8.3 percent.” Rauch also reports that in Canada a 10 percent increase in immigrants from a given country eventually increases Canadian exports to that country by 1.3 percent and imports from there by 3.3 percent. |
- In-Country Spending in Context
- Non-Tourist Consumption
Throughout the world, consumption is a major driver of economic growth.[12] Consumption has a particularly strong and immediate impact when there is excess capacity or where people are un- or under-employed, as in Armenia. For this reason, even without new investment in fixed assets, which requires long-term capital, the economy can expand with little inflationary pressure. When there is excess capacity, expansion through consumption increases demand for variable inputs such as labor and materials. Especially for items with low input costs and short turnaround times, it does not require major financing. Indeed, much of this kind of expansion can be self-financed by small and medium size enterprises or by consumer advance payments.
| Some examples of short and medium-cycle products:
Custom-made furniture or a hand-knit sweater, two common items in a non-tourist Diasporan’s shopping basket, can often be ordered with a small down payment or advance for materials and a delivery time of two weeks or less. Much of the value added is the individual crafter’s labor, which usually finds its way directly into the economy in the form of increased demand for household needs – food, education, clothing, utilities. Some in-country spending has an even shorter cycle, e.g., fruit from a farmer’s market, a meal at a roadside khorovats stand, a guided tour of a historical site, a ticket to a concert, or a night’s stay at a bed and breakfast, each of which requires minimal fixed asset investment on the part of the providers of these goods and services and has readily available inputs that draw on existing capacity. There are also longer term, 3-6 month cycles, e.g., renovating and furnishing an apartment, instruction in language, music, arts or sports, which are common goods or services consumed by non-tourist Diasporans. |
-
- Non-Tourist Consumption vs. Tourist and Local Consumption
Non-tourist Diasporan consumption, while similar to some local consumption or tourist consumption, is distinct in a number of ways. Local consumption tends to focus on essentials, with low demand for medium to high-end services, with the exception of education, which, interestingly, is the second largest expense for most Armenian households.[13] In contrast, non-tourist Diasporans consume more medium- and high-end services, while also consuming some language, music, art or sports instruction. For example, a local consumer is more likely to do his or her own home renovations with family and friends at a rate discounted for past and future barters of similar services, whereas a non-tourist Diasporan is more likely to pay a non-discounted price, since the Diasporan seldom has past barter “credits” and may not want to be involved in future barters. While a local consumer probably has a family member who knits sweaters or prepares jams and dried fruit for the winter, the non-tourist Diasporan does not and therefore purchases these kinds of goods and services, expanding the economy. The regular tourist, on the other hand, tends to consume more goods and services provided by larger organizations or companies; this income translates into local jobs and salaries, but much of it may be directed toward the purchase of foreign-produced capital goods or materials. Also, the average tourist does not usually consume as wide a range of services and goods as the non-tourist Diasporan, who has more motivation to buy renovation and repair services, instructional services, house-cleaning, and other goods and services from local providers.
-
- Non-Tourist Consumption vs. Export Consumption and Investment
Non-tourist Diasporan consumption is significantly different from export consumption and investment. Because exporting is usually too complicated for small and medium-sized enterprises, the export sector tends to be concentrated in larger companies. Expanding exports generates income for these companies and jobs for their workers, and since much of Armenia’s exports are agricultural, this results in a fairly broad distribution of the benefits from exports throughout the country. Investment also tends to be concentrated in larger businesses that have the sophistication necessary to obtain investments and report to investors. Moreover, a significant portion of the income generated from manufactures and investment cycles directly out of the Armenian economy in the form of foreign equipment purchases and finance charges. In contrast, non-tourist consumption tends to gravitate toward small and medium size enterprises, to be more diversified, service sector-oriented, and thus, more likely to translate directly local economic expansion.
- Who are Non-Tourist Diasporans?
Repatriates, students, volunteers, campers, business people – these are some of the subgroups within the category of non-tourist Diasporans – anyone who comes to Armenia on a regular basis or lives in Armenia long enough to maintain a household or business. They move beyond being visitors that primarily interact with the tourist economy, e.g., hotels, restaurants, and tourist attractions. According to official statistics in 2002-2003 Armenia welcomed 180,000 tourists. There are no official statistics on numbers of foreign students, volunteers, foreign workers, non-citizen residents (other than refugees), and repatriates, but unofficial estimates would place these at under 25,000. There are also an increasing numbers of summer campers, medical patients, and foreign university students. Currently, for example, 30% of the Applied Mathematics and Computer Science students at YSU and the Engineering University are non-citizens, and 30% of the students at the Medical School are non-Armenians, many from the Middle East, India and even China. Since they pay regular tuition, they are a significant revenue stream for these institutions and the country, cross-subsidizing local students in the same way that out-of-state students cross-subsidize in-state students at US public educational institutions.
- Composition of Non-Tourist Diasporan Consumption
- Direct spending
One of the easiest ways to understand the impact of non-tourist consumption is to track and analyze several typical examples of spending patterns:
What happens when a Diasporan student spends a semester (12 weeks) in Armenia at a university or spends time as a volunteer?
| Diasporan Student Budget for one semester (not including tuition and books) | $ |
|---|---|
| 1. Apartment rent or host family subsidy | $450 |
| 2. Entertainment | $400 |
| 3. Food – both eating in and at restaurants | $300 |
| 4. Gifts | $200 |
| 5. Visits by friends and family | $500 |
| 6. Tourism | $300 |
| 7. Purchases of clothing | $300 |
| 8. Other services – e.g., taxis, plumbing, medical services, laundry, cooking, cleaning | $300 |
| Total | $2,750 |
These are all forms of direct spending. The recipients in turn spend their earnings, by and large, on locally produced products and services, food, education, medical care.
Another more dramatic form of direct spending is buying an apartment, which sets off a chain reaction that may be repeated 2-3 times in a single year.
| Estimated Impact of a Diasporan Apartment Purchase | $ |
|---|---|
| 1. Diasporan buys apartment | $25,000 |
| 2. Renovations – materials (many imported), services (all local) – employs on average 10 different skilled and unskilled workers, including architects, designers, carpenters, plumbers, electricians, plasterers and painters, window-fitters, etc. | $9,500 |
| 3. Furniture – often locally made from mostly local materials | $2,375 |
| 4. Appliances – almost all foreign, but profit filters into local economy | $1,550 |
| 5. Drapes, floor covering – often locally made, mostly from local materials | $575 |
| Total | $39,000 |
All of these expenditures are repeated, perhaps on a lesser scale, by the seller of the apartment who in turn would move into a new apartment, thus perpetuating the “ripple-effect.” In addition, local sellers channel a portion of the proceeds of the sale into consumption, savings and investment. Thus, the transaction converts what Hernando de Soto has called “dead capital’ or “frozen wealth,” at least in part, into new liquidity in the Armenian economy.[14]
The multiplier effect on the economy is comparable to that caused by expansion in the housing and construction sector in the US.[15] What was once “dead capital” creating neither jobs nor cash flows, results in $25,000 direct inflow in the form of cash paid for the apartment and $14,000 in additional spending for local goods and services, none of which would have happened, but for the non-tourist Diasporan’s stay in Armenia. This is further amplified by the fact that a modern, renovated apartment then attracts others to visit Armenia. Those who stay as guests feel free to spend what they save on “lodging” on other goods and services such as handicrafts, performing arts, travel around the country, subsidizing the arts and education, contributing to worthy causes, or buying food and clothing. This activity in turn diversifies the impact of tourist spending beyond the few sectors in which it is usually concentrated.
Further, the former owners of the two apartments that changed hands also would have done renovations, hired workers, bought appliances, and in many cases saved or invested part of the proceeds of the sale. In total, one Diasporan purchase of an apartment generates conservatively a $40,000 to $50,000 impact on the Armenian economy.
-
- Indirect Spending – Follow-on Spending on Exports
While both tourists and non-tourists, as well as émigrés from Armenia, continue to infuse the Armenian economy with funds, often in the form of remittances and charity, increasing consumption of Armenian exports is the natural follow-up to a non-tourist stay in Armenia. Like émigrés, non-tourists tend to have formed close bonds of trust with various local friends and family, thus they engage in remittance support and respond to requests for specific interventions for health, education or investment. In terms of patterns of consumption, non-tourists are somewhat distinct from émigrés and tourists. While émigrés may seek first to satisfy their desire for foreign goods and adapt to their new milieu before engaging in “nostalgia buying,” non-tourist consumers tend to purchase Armenian products as an expression and reinforcement of their continued tie to Armenia. Having become accustomed to Armenian products and acquired a taste for certain Armenian artwork and food products, they “buy Armenian.” Tourists sometimes acquire this affinity for Armenian products, but their patterns are generally more sporadic.
- Export Consumption – Diasporan Basket of Armenian Goods
Non-tourist Diasporans are more likely to give Armenian products as gifts, to promote them to their Armenian and non-Armenian friends and feel nostalgia for them when they leave Armenia. Due to these factors, the impact of export consumption on the Armenian economy could be immense.
As set forth in Appendix 2, within the limits of current excess capacity, simply assembling a Diasporan consumption basket for Armenian wine, beer, cheese, dried fruit, preserves, and processed fruit and vegetables would result in $76 million additional exports, or an increase of 12% in exports.[16] Moreover, applying the multiplier of 2, which is the World Bank estimate for Armenian exports, the impact of this modest modification of Diasporan consumption patterns could increase overall GDP by $152 million or 6%, resulting in approximately 7,000 new jobs.[17]
Comparison of potential Diaspora demand and Armenian supply in the main foodstuffs industries
| Product | Excess current capacity ($ mln) | Potential Diaspora Demand ($ mln) | Demand Coverage Ration (%) |
|---|---|---|---|
| Cheese | 28.9 | 137.6 | 21 |
| Processed Fruits & Vegetables | 3.5 | 252.9 | 1 |
| Wines | 29.2 | 291.3 | 10 |
| Beer | 12.9 | 518.8 | 2 |
| Dried Fruits | 0.9 | 58.8 | 2 |
| Total | 75.4 | 1,259.2 | 6 |
| Diasporan export consumption has the short-term potential to create thousands of jobs and bring substantial, sustainable economic growth to Armenia in the order of tens to hundreds of millions of dollars per year, within Armenia’s existing production capacity, without significant risk or burden to the diaspora. Non-tourist Diasporan programs are among the major factors contributing to the creation of markets for Armenian exports.
Thus, non-tourist Diasporan programs are among the most effective means for promoting Armenia’s economic growth and job creation |
Summary:
Consumption is a key driver of economic growth for Armenia. Increased spending correlates with increases in GDP, which in turn translate first into higher productivity of current job-holders and then into new jobs. In comparison with FDI, non-tourist consumption has a faster impact, and in comparison with remittances, non-tourist consumption creates more jobs as it tends to be directed to local services, as opposed to goods and imports. Moreover, in comparison with FDI, in which only a small percentage of Diasporans have the financial resources and experience to engage, all Diasporans are in a position to consume Armenian products. At the same time, a large, stable export market for Armenian products will make FDI more attractive. Non-tourist Diasporans are trend-setters for Diasporan consumption, in Armenia and abroad. Thus, investment in non-tourist Diasporan programs in Armenia is the fastest acting, highest return investment vehicle available today for growing Armenia’s economy, as well as an effective way of strengthening Armenian communities worldwide, building ties that lead to investment, cultural enrichment and national renewal.
How each AVC volunteer has tremendous quantifiable economic impact on Armenia…
“Back of the Envelope” AVC Economic Impact
| Inputs | Calcs (USD) |
|---|---|
| Average annual salary of a Diasporan (home) | $45,000 |
| Average salary equiv. of a Diasporan (in Armenia) | $12,000 |
| AVC hours logged | 35,000 |
| Number of volunteers | 28 |
| Hours logged per volunteer/per week | 24 |
| Hours to 1 FTE job ratio | $1920 |
| Volunteer output/jobs equivalent (FTE - annual) - SK & Canada comp. | 18 |
| Volunteer org output per job (work related impact on economy) | $19,031 |
| Comparable economic output in Armenia from AVC volunteers | $346,847 |
| Total direct spent per volunteer/month | $500 |
| Direct spend for all volunteer | $168,000 |
| Visits created | 28 |
| Average spent per person per visit per 2 weeks | $1000 |
| Value of visits created | $28,000 |
| Approximate % of volunteers buying houses | 30% |
| Number of volunteers buying a house | 10 |
| Approximate value of a house | $25,000 |
| FDI per volunteer on average (real estate) | $250,000 |
| TOTAL value before multiplier effect | $792,847 |
| Money multiplier (not direct job related) - Indian comparable | 1,42 |
| TOTAL value after multiplier effect (outside of job) | $1,125,843 |
| Average impact per volunteer (post multiplier) | $40,209 |
| Overall impact as percentage of GDP | 0.05% |
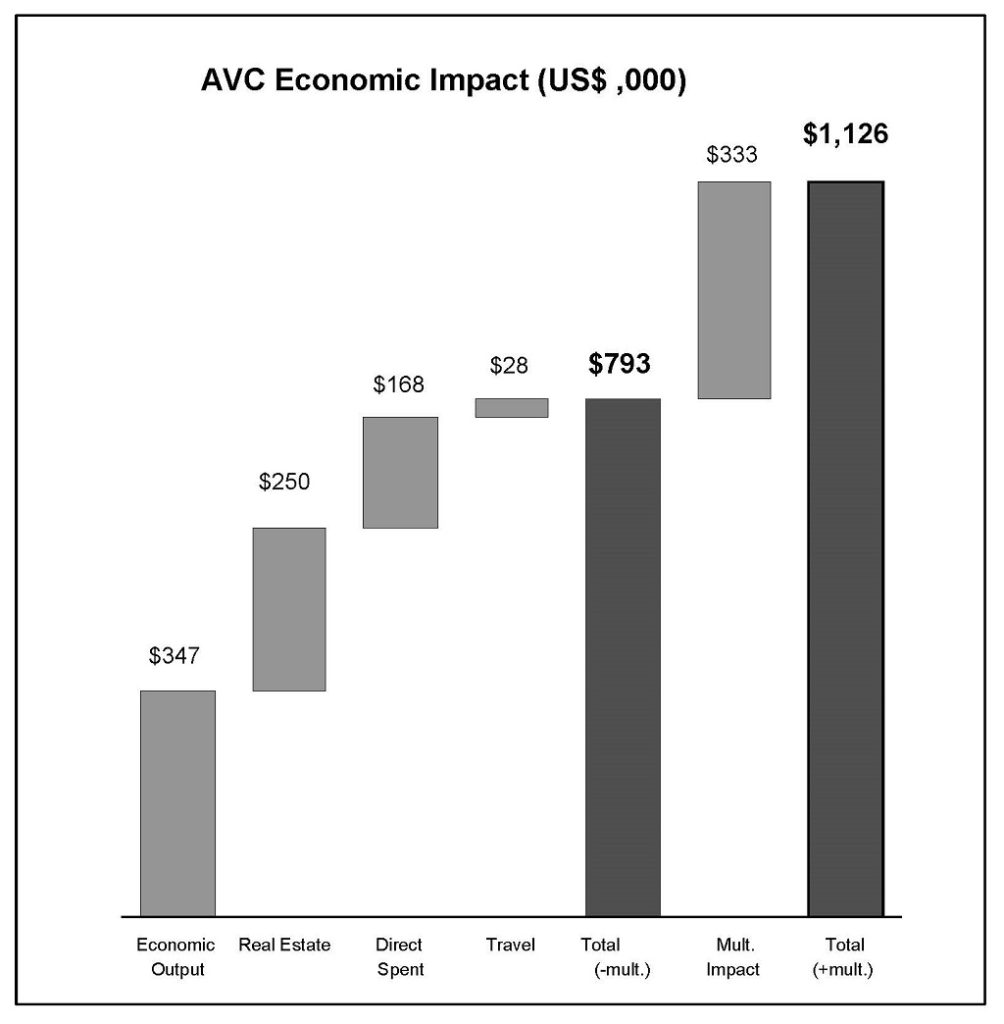
Our research therefore suggests that:
- The average impact per AVC volunteer is over $40,000.
- The net impact before the money multiplier effect for the 28 volunteers is approx.$800,000
- The net impact after the money multiplier effect for the 28 volunteers is over $1.1 million
Scaled Economic Impact
| Number of Volunteers | Volunteer Impact Before Mult. Effect ($,000) | Volunteer Impact After Mult. Effect ($,000) | Impact on GDP |
|---|---|---|---|
| 100 | $2,687 | $3,815 | 0.16% |
| 300 | $8,060 | $11,445 | 0.48% |
| 500 | $13,434 | $19,076 | 0.80% |
| 750 | $20,151 | $28,613 | 1.20% |
| 1,000 | $26,868 | $38,152 | 1.60% |
| 2,000 | $53,736 | $76,304 | 3.21% |
- A robust model can be built to show the volunteers’ impact on:
- Job creation
- Investment rates
- Disposable income and consumption rates etc.
Source: Strategic Audit of the AVC, Razmig Hovaghimian, The Cloverfield Group, (2003)
Main Sectors with Potential for Export-Driven Growth
This Appendix explores the relationship between Diasporan demand and Armenian supply for a group of consumer products with the most promising short to medium-term export potential for growth. Given the central premise of this study that short-term role Diaspora consumption has an essential role to play in alleviating poverty in Armenia (rather than helping to facilitate the re-structuring of the Armenian economy), this appendix aims to quantify:
- The excess capacity of sectors in the Armenian economy that produce consumer products and have the highest export-growth potential;
- The volume of exports the Diaspora has to consume to ensure that this excess capacity is fully exploited and full employment of labor and capital in these sectors ensues;
- The effect this increase in consumption of Armenian exports will have on the Armenian economy and on Gross Domestic Product (GDP) in particular.
Within the scope of answering these questions, our inquiry extends to finding which sectors among the those selected for study, given supply and demand constraints, have the highest growth potential and how they impact GDP growth. Should GDP growth be the only measure of success of increased Diasporan consumption? Which sectors have the highest chances of success in each Diasporan market, and what does that mean for a future Diaspora-focused “Buy Armenian” marketing strategy?
The model that we use to explore answers to these and other pertinent questions is defined below.
Model Definition
- The Choice of Diaspora Markets
The Diasporas in Russia (2.5 million) and the USA (1.4 million) have very significant potential as markets for Armenian products simply due to their size, and this is reflected by current high (by Armenian standards) exports from Armenia to the areas in these countries where many Armenians live.
The Armenian Diaspora in Russia is unique in comparison to the others elsewhere in that it is more preoccupied with immediate legal, political and economic interests rather than striving to build a traditional Diaspora based on the task of preserving national traditions and language. According to the International Center for Cooperation with Armenian Communities, two-thirds of the 2.5 million Armenians living in Russia, moved there during the last 10 years, and they are the most attached to Armenia in following traditions and keeping close contacts with the homeland. This includes consumption of Armenian products, and as a result, Russia has been the largest importer of Armenian products (about $65 mln in 2002) over the last several years. The remaining 1 million are far less likely to consume Armenian products since their consumption patterns are similar to local Russians, and they have fewer emotional ties to Armenia and its products. In terms of location, apart from Moscow and the Moscow region, St. Petersburg, and Krasnodar, it is difficult to quantify the Armenian population in other areas of Russia. That statistical gap accounts for why market studies for Armenian exporters tend to focus on these areas.
The American market is of course dominated by the Armenian population in Los Angeles estimated at around 1million, including about 250,000 “new Diasporans,” who arrived after the collapse of the Soviet Union. It would be fair to say that the majority of current Armenian exports to the US, almost $46.5 million in 2002, are consumed by these Armenians who naturally have closer ties to Armenia and miss some of the products they were used to. The fact that US imports have been consistently lower than Russia’s in the last decade is probably due to the large difference in size of these “new Diasporans.” The implicit assumption of this study is that as soon as Armenian producers and exporters start adapting their products to the regional preferences of the “old Diasporans” whose tastes have naturally assimilated to those of their regions/countries of residence, then Armenian exports to these consumers will rise significantly. With approximately 1.1 million “old Diasporans” who have high annual consumption patterns, US markets could be seen as a goldmine if Armenian producers are able to tailor their goods to Western tastes and break barriers to entry such as certification, labeling etc.
France, with its population of approximately 400,000 mostly split between Paris, Marseilles and Lyon, (about 150,000 each), is remarkable for having very low levels of Armenian imports ($1.1million in 2002).
Demand-side reasons for this include:
- The relatively low number of Armenians who have emigrated from Armenia in the 1990’s as in the case of Russia and the USA, as well as “nergakhtoghner” who returned to France in the ‘70’s and ‘80’s
- The Armenians of France feel very comfortable with French culture and preferences, especially given European consumers’ tendency to consume mostly local goods;
- The global reputation of the French food sector (a key Armenian export sector) is well-earned and makes it very difficult to compete in France in this sector.
On the supply-side,
- The EU market is probably the hardest one to export to, especially for food processors, due to strict quality standards, unlike those required in CIS countries;
- Transportation costs to European countries are almost 30-40% higher than to the CIS, usually rendering Armenian goods uncompetitive in comparison to rivals.
Despite these factors however, with the creation this year of an EU certified compliance laboratory in Armenia and the integration of Western European preferences into Armenian exports, there is definitely potential in this market. This is especially true given the size and close concentration of the Armenian populations there. Since building a stable consumer and sales base in the EU is known to be very difficult, the Diaspora in France could be crucial for Armenian exporters in providing a springboard to enter the wider EU market proper.
The Armenian Diaspora of the Middle East is concentrated mainly in Iran, Syria and Lebanon and is estimated to be around 500,000, with the largest populations in Syria (125,000) and Lebanon (218,845). Furthermore, Armenia has sound political relations with Middle Eastern countries and reasonably safe, inexpensive transport routes through Iran. Yet despite these positive factors, Armenian trade with Syria and Lebanon is almost non-existent and in 2002 only Iran bought imports from Armenia ($31 million). One explanation is that only the UAE (to which Armenia exports doubled in 2002) in the entire region have a genuinely open economy, with most countries, especially Iran, having closed protectionist economies favoring local companies with very high tariffs and trade barriers to foreign goods. Nevertheless, with low transport costs, a large potential Diasporan and non-Armenian market and relatively low competing quality standards, the Middle East is a key market for Armenian exporters.
The table below shows the estimated size of Armenian Diasporan populations in 2002 for the four key markets chosen for this study. In addition the table shows the total consumption figures in 2002 for each of the targeted countries/regions and an estimate of the annual consumption of the Armenian populations in these locations based on the model described above.
Table 1: Armenian Diaspora population and total annual consumption in the four key regions worldwide.
| France | USA | Russia | Middle East | TOTAL | |
|---|---|---|---|---|---|
| Total population | 58,520,000 | 292,357,697 | 144,000,000 | 89,290,400 | 525,706,617 |
| Total size of Armenian Diaspora in country or region | 400,000 | 1,400,000 | 2,500,000 | 500,000 | 4,800,000 |
| Total annual consumer expenditure in country or region | $1.013tln | $6.962tln | $0.247tln | $0.298tln | $8.52tln |
| Total annual consumer expenditure of the Armenian Diaspora in the country or region | $7.382bln | $33.341bln | $4.28bln | $1.66bln | $46.663bln |
- The Choice of Sectors
The sectors chosen for detailed analysis are those that in the first place, produce consumer goods that can be sold to Diaspora markets worldwide, and in the second, have the greatest export potential in countries where selected Armenian Diasporas reside. Products in these sectors must be attractive not only to the Diaspora but also, following certain supply-side adjustments, to wider markets in these countries. That is not to say that these products will be successful in the medium or long-term in all of the highlighted countries this survey is targeted towards. There may well be significant differences in the popularity of some or most of these goods in different markets: e.g., Armenian beer may be extremely popular with Russian consumers but utterly unsuccessful with French counterparts.
This model focuses on the sectors discussed below after considering:
- Short to medium-term consumer preference trends in the countries with the largest Armenian Diasporas;
- The goods that Armenia is currently exporting or has the potential to export without very large domestic investment, or time lags.
Our approach to finding these sectors was to begin by looking at the main exporting sectors within the Armenian economy during the last four years (1999-2002), and then to focus on those that had high or significantly increasing exports and which produced consumer goods.
The table below shows the major exports by sector in the Armenian economy for the period 1999-2002.
Table 2. Major Exports by Sectors 1999-2002
| Year | 1999 | 1999 | 2000 | 2000 | 2001 | 2001 | 2002 | 2002 |
|---|---|---|---|---|---|---|---|---|
| US$ (mln)/ % of total | US$ (mln) | % of total | US$ (mln) | % of total | US$ (mln) | % of total | US$ (mln) | % of total |
| Agricultural products | 1.8 | 0.8 | 2.5 | 0.8 | 2.6 | 0.8 | 4.5 | 0.9 |
| Foodstuffs | 15.9 | 6.9 | 27.3 | 9.1 | 48.0 | 14.0 | 54.9 | 10.8 |
| Minerals and chemicals | 39.9 | 17.2 | 40.6 | 13.5 | 40.7 | 11.9 | 44.3 | 8.7 |
| Machinery and Equipment | 17.8 | 7.7 | 31.0 | 10.3 | 28.5 | 8.3 | 21.4 | 4.2 |
| Precious stones, metals, jewelry | 99.9 | 43.1 | 121.5 | 40.4 | 122.8 | 35.9 | 259.2 | 51.1 |
| Base metal and articles thereof | 25.0 | 10.8 | 44.2 | 14.7 | 43.4 | 12.7 | 44.8 | 8.8 |
| Textiles | 13.6 | 5.8 | 13.2 | 4.4 | 24.3 | 7.1 | 28.7 | 5.7 |
| Other | 17.8 | 7.7 | 20.2 | 6.7 | 31.5 | 9.5 | 49.4 | 9.8 |
| TOTAL | 231.7 | 100.0 | 300.5 | 100.0 | 341.8 | 100.0 | 507.2 | 100.0 |
Source: HSBC Bank, Armenia
Judging from the figures above, the Foodstuffs sector seemed to satisfy the necessary requirement best. As the second largest exporting sector in 2002 and with a steady growth in exports since 1999, the evidence seems to suggest that the food products sector has both the demand and the supply side potential to expand into foreign consumer markets. The sector is dominated by the food processing and drinks sub-sectors, which since 1995 have been have been a leading industrial driver of Armenia’s economic growth, constituting 37% of gross industrial production.
To find the food and drink products with the greatest export potential, we met with a wide range of experts in this sector, including export development professionals, Government officials as well as representatives of the local foodstuff industry. We found that for exporting, food processing enterprises specialize mainly in fruit and vegetable canning (fruit juices, jams, tomato paste, marinade, child nutrition etc.) and cheese, while the largest investment and growth in beverages has been in wines and beer. We therefore decided to focus our analysis comparing Diaspora demand and Domestic Armenian supply for these key products. The main findings of this preliminary research are shown in the table below.
Table 3. The main exports in the foodstuffs sector
| Product | Domestic Production (US$mln) | Foreign Exports (US$mln) | Exports as share of Production (%) | Export growth (%) |
|---|---|---|---|---|
| Beer | 1.5 | 0.33 | 22 | 25.7* |
| Wine | 4.76 | 1.21 | 25.4 | 69.4* |
| Cheese | 13.6 | 1.42 | 10.3 | |
| Processed Fruit and Vegetables | 3.07 | 2.59 | 84.1 | |
| Dried Fruit | 0.7 | 0.0863 | 12.3 | -13.8 |
| TOTAL | 231.7 | 100.0 | 341.8 | 100.0 |
Source: Ministry of Agriculture of the Republic of Armenia, Armenian National Statistical Service
Using these results, we met with experts in these sectors who had the professional experience to discuss with us in detail the potential foreign demand and local supply capacities of these product markets.
- Potential Demand and Supply
Potential Demand
In estimating the potential Diaspora demand for Armenian products, the following simple linear equation was used for each type:
Demand (QADXY) = PADXY/PX* DXY, where
| QADXY – Estimated total annual consumption by Armenian Diaspora of target country/region “X” for product “Y”PADX – Population of Armenian Diaspora in target country/region “X”PX – Total population of target country/region “X”DXY – Total annual domestic consumption of product “Y” in target country/region “X” |
The estimates resulting from this model are quite basic as they do not take into account the large number of parameters that affect consumer demand and expenditures such as disposable income, preferences etc. We have used this model however because of the dire lack of any reliable aggregate information on the consumption structures of Diasporan Armenians and key factors that affect their consumer decisions. Even basic demographic statistics such as age, income structures and size of Diaspora communities around the world, even in areas of known high concentrations of Armenians such Moscow, California, Paris and Beirut, do not exist. This underlines a crucial lack of organization and coordination within the Armenian Diaspora worldwide and is a fundamental issue that should be addressed sooner rather than later.
Given the lack of information required to make a thorough, informed analysis of the Diasporan potential demand for Armenian products, this study will therefore provide estimates of consumption by Armenians of similar products that are available wherever they live outside Armenia.
The model we used is therefore based on the following assumptions:
- Diasporan Armenians’ consumption preferences follow the same aggregate patterns as the population of the country in which they reside;
- The age and income structures of the Armenian Diasporas generally reflect those of the country in which they are located;
- Diasporan Armenians have a positive, emotional link to Armenia and would be willing to buy Armenian products rather than non-Armenian products if the main product characteristics (such as price, quality, health standards), are more or less the same.
The most common method of estimating this Diaspora potential demand function was by finding directly each targeted country’s total annual consumption in 2002 for the product under consideration.
In cases when it was not possible to find the total annual consumption or expenditure figures themselves, consumption per capita and average price data was used to find total annual consumption. Where consumption per capita figures and average prices were not available for 2002, these were extrapolated using aggregate income growth and inflation rates for the economies concerned.
Sectoral Analysis
3.1 BEER
- Demand-side analysis:
USA
The U.S. beer industry is a highly developed marketplace that after extensive consolidation in recent years is now dominated by several large national brewers. Overall consumption has been flat in recent years due to greater alcohol awareness, slow population growth and an aging population (young adults are the largest consumers of beer). In 2002, national consumption stood at $77.8 billion.
Despite these factors, there is still much potential in this industry for Armenian exporters due to the growth of niche markets resulting in a recent explosion of micro brewers (firms employing fewer than 20 employees). U.S. brewing establishments have nearly doubled since 1990 within the beer industry, and virtually all new entrants are niche players that cater to specialized, often regional but sometimes national, tastes for consumers who tend to accept higher prices more readily than the consumers of major brands. The market share of these smaller companies was estimated at about 11% in 2001. Thus, the US beer market could also have potentially long-term potential for Armenian beer exporters if they try to differentiate their products and use the Diaspora market as a platform for breaking into the larger market. The successful exporting of “Kotayk” beer to California in recent years, primarily to the Armenian communities there, shows the potential for creating this platform.
The Armenian Diaspora in the USA consumes about $372.9 million worth of beer annually according to our model. If they divert just their consumption of niche beers (11%) to Armenian beer, this would in itself create a potential demand of $41mln for Armenian suppliers.
RUSSIA
Russia is the largest consumer of all types of spirits that Armenia exports to the world and accounts for around 80% of total export of Armenian spirits to the world. Russian beer consumption in particular continues to grow and is expected to double by 2010. Currently, the total yearly consumption of beer is estimated to be approximately 7.2 billion liters and is worth $4,910,400,000
We estimate the Diaspora’s annual demand for beer to be roughly $85.25million.
FRANCE
The French beer market, with sales of around $8.49bln, is expanding with beer becoming a popular alternative to wine. Beer is drunk by 60% of the French population, mainly concentrated in the north of France and Paris. There is also a growing trend towards “ethnic” drinks such as Mexican and Latin beers (Corona, Desperados) that have significantly increased their market share (albeit from very low levels).
Competition however is high as the three largest local brands represent 85% of the market, with the remaining share being split between many local and foreign groups as well as SME’s. A way round this would be for Armenian producers to find foreign partners with strong positions already in this market. Kotayk for example, who already have joint ventures with the Castel Group for exports to the US, could use their foreign partner’s well-respected brand name in France to expand their exports in this market also.
We estimate that the Armenian Diaspora in France spends approximately $58million annually on beer.
MIDDLE EAST
Total demand for beer in Lebanon is $22,759,880 per year based on the assumptions that beer costs $5 per liter and that per capita consumption is 1.04liter beer on average. For Syria, the demand figure is $95,910,880 per year and $345,639,320 for Iran.
Our estimate of the total Diaspora demand for beer is $2.6 million per year.
| Total Worldwide Diaspora consumption of BEER: $518.75million |
Supply-side Analysis
Domestic production of beer in 2002 was worth $1,497,000 of which $330,000 (22%) was exported. These exports went mainly to Russia and the US, in particular California, suggesting that Armenian beer is, understandably, successful in the markets that have large “new Diaspora” communities.
The capacity of this sector is difficult to evaluate given that beer was not a large industry in Armenia during the Soviet times and is only really expanding now after independence. Having said this, estimates from sector experts suggest that the utilization rate in the beer industry may be as low as 10%. This would imply that domestic production could increase to $14,371,200.
| Within the limits of estimated Current Excess Capacity, potential increase in domestic exports of BEER: $ 12,544,200 |
3.2 WINE
- Demand-side analysis
USA
In 2002, total US wine consumption saw its largest rise since 1992, increasing by 6% to $21.1billion. Despite being dominated by domestic and in particular California wines (74% market share), the market is open to both imports and smaller, differentiated brands. More than 6,500 domestic and foreign wines are sold in the U.S. and for 96% of these, sales were less than 100,000 cases in 2002. Combined volume for these products roses by 6.4 % in 2002, constituting 22% of total wine consumption. In addition, demand for imported table wine, which Armenia has the potential to supply, rose by 14% in 2002. [Perhaps a one sentence reference to the continuing substitution opportunity of other countries’ products immediately following the collapse of the French wine import market (after France’s perceived anti-Americanism during the Iraq invasion) is in order?]
Despite the popularity of domestic wines and competitive, high quality imports in the US market, wine consumption of the Armenian Diaspora should be seen as a very interesting opportunity, at least in the short-term, for Armenian wine producers.
This size of this market is approximately $101million.
RUSSIA
The wine industry has been marked by high consumption growth rates since 2000. Also, Russian wine production is growing by around 9.5% and imports rise by 25% yearly. Based on the data of the Russian Imports Stats, major exporters of wines to Russia are Moldova, Georgia, Ukraine and Azerbaijan. In numbers, total yearly consumption of wine in Russia is estimated to be nearly 431,244 million liters or $4,845,600,000.
Thus, Diaspora demand for wine is estimated to be $84.125 million per year.
FRANCE
Despite an almost universal decrease in consumption of alcoholic drinks in general, the French wine market was still worth over $13.4 billion in 2002. Still wine has 85% of the total and still red wine accounts for 60% by volume. Given the global dominance of French wines, imports hold only a limited share of the local market, around 3% in 2001 ($576mln). These imports are mainly well-known Italian, Spanish and Portuguese wines that also have fewer barriers to entry due to EU membership. Yet in spite of this competition and the significant technical barriers to the French market, some Armenian companies have been exporting to France for the last three years (albeit at quite low levels) despite having done very little marketing research. This suggests that, especially if the Diaspora is well-targeted as a lead market, the French market could have genuine potential. [partnerships with local French producers as more realistic approach?]
The French Diaspora’s substantial expenditure on wine is estimated at about $91.6mln in 2002.
MIDDLE EAST
We used data from Wine Institute of California to examine the wine market for Lebanon., The value of total expenditures on wine in Lebanon is nearly $129,556,240 per year.
For Syria and Iran, the per capita consumption rate is assumed to be the same as in Lebanon, namely 3.3 litres a year. Based on this figure and taking the price of wine per liter at $8.86, the total annual consumption figures for Syria and Iran are $539,277,367 and $1,943,423,546 respectively.
Total consumption of wine in these three countries is estimated at $2,612,257,153 per year.
We estimate total Diaspora demand for wine in this market at $14,627,872 per year.
| Total worldwide Diaspora consumption of WINE: $291.35million |
- Supply-side Analysis
The value of local wine production in Armenia was $4,756,197 in 2002. 25% of this output, worth $1,205,305, was exported.
The industry utilization rate is estimated at approximately 14% at the present time, suggesting an increase in local production of $29,216,639 is possible. At full capacity therefore, total domestic production would be $33,972,836.
| Within the limits of estimated Current Excess Capacity, potential increase in Armenia’s exports of WINE: $29,216,639 |
3.3 CHEESE
- Demand-side analysis
USA
Total US consumption of cheese in 2002 was $7.3bln or 30.6lbs per capita, continuing the steady upward trend since 1988. Based on this, we assume the Armenian-American Diaspora spends about $35.4mln annually on cheese. This statistic will probably rise as national consumption is expected to continue increasing in the coming years (USDA estimates consumption of 33lbs per capita in 2012).
The US market also provides excellent opportunities for Armenian exporters beyond the Diaspora. The increase in domestic consumption can be partially attributed to a growth in specialty or gourmet cheese of high quality, limited quantity and high value. These types of cheese have some unusual, highly differentiated characteristics such as exotic origin, distinctive processing, exceptional packaging etc. According to Business News Publishing, the US sales of such types of cheese rose in 2001 by 4.8% from 2000. A wide variety of these specialty foods is already currently being imported, and the Diaspora can play a key role with its consumption in helping to promote and develop Armenian cheese to exploit the potential long-term export potential the US cheese market provides.
RUSSIA
The tradition of consumption of cheese in Russia differs considerably from western societies. Domestic manufacturers cannot offer diversified production yet, because of quality and taste concerns. Another advantage for an Armenian supplier is that many types of cheeses that have the greatest popularity in Europe or in America are not familiar to the Russian customer. Russians mostly prefer firm cheeses and in recent years string cheese became very popular.
Imports in terms of total consumption volume account for about 65%. Major cheese suppliers in the Russian market are Germany and Ukraine with 30% and 27% respectively. Next come France, Lithuania and Finland. Armenian suppliers make up less than 4% of the total share of other countries. Despite a recent report on Russia’s consumption structure by GfK Market Research Russia suggested that there is an increase in Russian consumption of fats and diary and a decrease in their spending on soft drinks and snacks, Russia’s cheese consumption remains very low compared to other countries. Per capita consumption of cheese is 3.9 kg. For Armenian producers at the very least, the Diaspora remains a very inelastic demand for Armenian cheese based on the assumptions made concerning Diaspora consumption preferences.
Using the outlined methodology, we can estimate that total Diaspora demand for cheese will be approximately $ 47.775mln per year.
FRANCE
France has the highest figures for annual per capita consumption of cheese in the world, with domestic expenditure amounting to $5.128bln in 2002 and rising consistently in recent years. Each inhabitant consumes approximately 24.5kg, the most popular being fresh cheese (8.1kg per capita), cooked pressed cheese (4.9kg per capita) and uncooked pressed / hard cheese (3.9kg per capita).
Households account for 80% of total cheese consumption and imports amounted to [Consistency issue: why use Euros here — nowhere else?] €0.7 billion (197,900 tons) in 2002 or 14% of household cheese expenditure.
These imports came primarily in the form of cooked and uncooked pressed cheese or specialty products (mozzarella, gorgonzola) from three other EU members, Germany, the Netherlands and Italy. A strong presence of foreign cheeses suggests that although the French market looks saturated, there is still a desire for new tastes, and innovative products can be very successful.
Given the relative importance of private household expenditure in this market and the inclination toward new products, it would be safe to assume that there is both long and short-term promise in Armenian cheese producers targeting the French-Armenian Diaspora.
Currently the French Armenian Diaspora spends approximately $40.9mln annually on cheese.
MIDDLE EAST
Total consumption on food per capita is 33% in Lebanon, or $1.116 and 24%, or $789 in Iran. According to the Economic Research Institute, 9.5% of expenditures on food in Lebanon is spent on dairy products amounting to $329.29 of which 20% is spent on cheese. Thus per capita expenditures on cheese in Lebanon constitute $66 per year. Estimated total expenditures on cheese in Lebanon are around $288,875,400.
In Syria, total food consumption per capita is $2.120 or 61%, 12.2% of which is spent on dairy products amounting to $258.64, with 20% spent on cheese. Hence, per capita expenditures on cheese in Syria are about $51.68 USD, resulting in a total of, nearly $953.2million per year.
And finally, in Iran, 11.1% of total consumption is spent on dairy products, with $87.6 per capita, of which 20% is assumed to be spent on cheese, or $17.52 per capita. Hence, total expenditures on cheese in Iran are roughly equal to $1.16 billion per year.
Using our model, we calculate that total annual expenditure of the Armenian Diaspora in major Middle East countries on cheese is roughly $13.5 million
| Total Worldwide Diaspora consumption of CHEESE: $137.575million |
Supply-side analysis
During the final days of the Soviet Union, the Armenian cheese industry had an annual capacity of 30 million tons. Current production is roughly 4.8 million tons and has a value of $13,627,469 including $1,415,929 of exports.
Experts at the Armenian Ministry of Agriculture estimate that the maximum capacity of the cheese industry today is close to15 million tons, which, at current prices, would be worth $42.5 million. This implies that industry output and thus exports (if domestic consumption stays constant) can increase by 10.2 tons or $28,884,956.
| Within the limits of estimated Current Excess Capacity potential increase in Armenia’s exports of CHEESE: $28,884,956 |
3.4 Processed Fruit and Vegetables
Demand-side analysis
USA
Having the largest food processing industry worldwide ($434bln), US consumption of processed food is by far the highest globally, with total US domestic consumption of processed fruit and vegetables at about $22.0.bln in 2002. Despite a $50 billion domestic industry, processed fruit-and-vegetable imports have risen substantially in recent years, amounting to $2.7bln in 2000. Apart from traditional compotes and jams, Armenian organic goods could also be successful in the US given the rapid recent growth in US consumption of these goods from $1.6bln in 1997 to $6.3bln in 2002 (according to USDA figures). Such exports could prove to be popular both with the Diaspora US but also with non-Armenians in the US. in accordance with current trends.
We estimate that Armenian-American consumers spend roughly $105.6mln in total on processed fruit and vegetables.
RUSSIA
Despite the growth of the Russian fruit and vegetable processing industry in recent years, significant domestic consumption is still being satisfied primarily by foreign imports, in particular from Turkey and the Middle East countries. Per capita expenditure on processed fruit and vegetables in Russia was $27.8 in 2002. Thus, the Russian Diaspora’s annual demand for processed fruit and vegetables is approximately equal to $69.7mln.
FRANCE
France has the largest food processing sector in Europe, worth more than $155bln in 2001. French consumer expenditure on processed fruit and vegetables, the two main strong Armenian sub-sectors in this industry came to $8.069bln in 2002.
Potentially successful product areas (excluding dried fruits that will be addressed separately below) include: i) frozen foods (ready-to-eat meals and specialty products); ii) snack foods; iii) ethnic foods; iv) innovative diet/health and organic foods. All of these are attractive products for both the Diaspora and also the wider French market.
We estimate Armenia Diaspora consumption in processed fruits and vegetables to be approximately $55.15mln.
MIDDLE EAST
The Middle East market for processed fruits and vegetables is considered an attractive niche for many exporters despite the fact that these countries have strong and developed local production. In 2002, total expenditures amounted to roughly $4bln which confirms its status as a big market that imports considerably. In comparison to Russia, where the cold climate enhances the consumption of these products, the total consumption in the Middle East is even higher than in Russia, with per capita consumption of processed foods and vegetables at $45, meaning $18 higher than per capita consumption in Russia.
Total annual Middle East Diaspora demand for processed fruits and vegetables therefore will be close to $ 22.4mln
| Total worldwide Diaspora consumption of PROCESSED FRUIT AND VEGETABLES: $252.85million |
Supply-side Analysis
The production of processed vegetables in 2002 reached 52 million tons, with an approximate value of $2,500,000. The vast majority, close to $2,250,000, was exported. Yet, with a 100% utilization rate, the industry has the potential to grow to almost double its current size, producing up to 100 million tons or $4,800,000 worth of product. This implies that the industry has the capacity to increase production and thus exports by around $2.3million (48million tons).
The processed fruit industry had production worth approximately $571,430 (5.9million tons) in 2002 with exports of $342,858. The industry’s utilization rate however is currently quite low. Industry experts suggest that output given current capital and labor endowments could increase to 18million tons, raising total value to more than $1.74million. The potential increase in domestic production therefore is worth roughly $1.17million.
| Within the limits of estimated Current Excess Capacity potential increase in Armenia’s exports of PROCESSED FRUITS AND VEGETABLES: $3.47million |
3.5 DRIED FRUIT
USA
US consumers’ expenditure on dried fruit totaled $715.21mln in 2002, yet Armenian exporters have not been able to break into this market. The main problem is that the main foreign suppliers, such as Turkey and the North African countries, offer significantly lower prices than Armenia. Hence, as in France, for Armenian exporters trying to enter the foreign market, the Diaspora represents their main prospect. Given the price differential, however, the gains may not be very significant unless Armenian producers successfully target the up-scale market for differentiated natural and organic food.
We assume that Armenians America consumed roughly $3.4mln of dried fruit in 2002.
RUSSIA
Before the collapse of the Soviet Union, a typical Russian consumer was not used to dried fruit assortments and Russians rarely used dried fruits in desserts or as delicacies. However, nowadays the dried fruits market in Russia flourishes; as many exporters from Eastern regions enter the market, people become more familiar with these types of food. Armenia also can be considered as a major exporter of dried fruits to Russia, as Armenia has always had a wide range of tasty fruits (apricots, peaches and grapes of all kinds). Still, in Russian the per capita consumption is very low compared with Armenia. It is around 1.4 kg, while the average Armenian consumes 5.7 kg of dried fruits yearly
Russian Diaspora demand for dried fruits is estimated to be $34.86 million per year.
FRANCE
In 2002 the total market for dried fruit in France was in the range of $249.6mln, of which approximately 95% was imported, particularly from Iran, Turkey and North Africa.
The big potential demand for dried fruit in the French market as a whole is from domestic food processors for industrial baking. Armenian dried fruit is not price competitive relative to similar products from other countries, even though its quality is often higher.
On the retail side, although the Diaspora may well be willing to pay more for the same product simply due to its Armenian origin, it will be difficult to expand this market unless Armenian producers can create a very good marketing strategy. So far however, attempts to sell Armenian dried fruit have failed due to the price factor.
French Diasporan annual dried fruit consumption is about $1.71mln annually.
MIDDLE EAST
Based on USDA consumption data, 15% of all expenditures on fruits and vegetable is spent on dried fruits in the Middle East. Further, taking the per capita total expenditure share of fruits and vegetables to be 35.1% for Lebanon, the total amount spent on fruits and vegetables and dried fruits will be $391.7 and $58.8 respectively. Thus, total demand for dried fruits in Lebanon is around $257,361,720 per year. Using the analysis, the total demand figures for dried fruits in Syria (if fruits and vegetables share of total expenditure is 27.8%) and Iran (if fruits and vegetables share of total expenditure is 18.6%) will be $1,630,484,960 and $1,462,320,200 respectively.
Total Middle East Diaspora demand for dried fruits will be nearly $18,759,950 per year.
| Total Worldwide Diaspora consumption of DRIED FRUIT: $58.73million |
- Supply-side Analysis:
The dried fruit industry in 2002 produced 176.1 tons of output worth just less than $720,000, with 21.1 tons exported ($86,100). 60% of these exports went to Russia.
But industry representatives suggest that the utilization rate is currently just 44%, implying that total dried fruit output could increase to up to 400 tons, which at current prices would be worth around $1,638,862.
| Within the limits of estimated Current Excess Capacity potential increase in Armenia’s exports of DRIED FRUITS: $918,862 |
Using this demand and supply side research of key products in the foodstuffs sector, the next section compares worldwide Diaspora consumption and domestic Armenian production. We summarize the main conclusions and findings so far and provide answers to the most important questions raised earlier in this paper.
In particular, this section
- Provides estimates of the proportion of worldwide Diaspora consumption for each product that would need to be diverted to the consumption of similar Armenian exports in order to ensure that domestic industries are operating at full capacity, assuming no change in domestic Armenian consumption patterns;
- Based on the estimates described above, evaluates the effect that this specific increase in consumption of Armenian exports will have on the Armenian economy and in particular the level of GDP.
- Raises some key practical issues, problems and opportunities regarding the implementation of a strategy to realize this goal.
Conclusions
In addition to all the assumptions of this model outlined earlier, the conclusions presented below are based on the premise that domestic consumption in Armenia stays constant so that the full increase in domestic output is consumed entirely by Diasporan Armenia worldwide.
In drawing conclusions on the potential of the different products leading to the highest possible growth in the Armenian economy, it makes sense to look first at the supply-side, and at the key aspects of domestic production of these products. The table below summarizes the main findings concerning domestic supply of the targeted products.
Table 5. Comparison of Armenian current and potential supply in the main foodstuff products
| Product | Current Production ($ mln) | Current Exports ($ mln) | Total Potential Capacity ($ mln) | Excess current capacity ($ mln) | Utilization rate (%) |
|---|---|---|---|---|---|
| Beer | 13.6 | 1.4 | 42.5 | 28.9 | 32 |
| Wine | 3.1 | 2.6 | 6.6 | 3.5 | 47 |
| Cheese | 4.8 | 1.2 | 34.0 | 29.2 | 14 |
| Processed Fruit and Vegetables | 1.5 | 0.3 | 14.3 | 12.9 | 10 |
| Dried Fruit | 0.7 | 0.086 | 1.6 | 0.9 | 44 |
| TOTAL | 23.7 | 5.6 | 99.0 | 75.4 | 24 |
A policy aimed at increasing the demand for those products whose industries have the lowest utilization rates, may have the greatest positive effects in terms of local labor employment or in terms of long-term environmental sustainability. The implication is that industries with low excess current capacity in terms of output value should not be disregarded if developing these industries though export consumption has very significant non-GDP related socio-economic benefits. This question calls for deeper analysis in terms of defining the goals of Diaspora consumption and further research in finding those industries with high non-GDP benefits. One could use two different criteria to judge the relative potential of each product. On one hand, it is clear that the products with the largest value of excess current capacity have the greatest potential in terms of increasing exports to the Diaspora and driving GDP growth. The sectors that stand out in this respect are cheese and wine, both of which have excess capacity valued close to $29million. Given that cheese was a large industry during the Soviet times, it should not be too difficult to increase production if there is an expression of interest from the demand side. Its utilization rate is low but is still more than double those of wine and beer. This brings us to the second criteria: utilization rate and desirable economic goals beyond GDP growth.
By both criteria wine is probably the most promising sector and should be promoted strongly. Beer and cheese also seem to have very significant potential though for slightly different reasons. The promotion of processed fruits and vegetables in comparison would seem to have lower but still significant gains as its output could double and lead to further investment to precipitate further growth. Exports of dried fruits could also double with increased Diaspora consumption, but the effect on GDP would probably be negligible.
Identifying wine, cheese and beer as the most promising sectors from the supply-side, we now look to the demand-side to determine what proportion of total Diaspora consumption in each product is required to realize the supply-side benefits outlined above.
Table 3.5 brings together the figures for potential Armenian exports (equal to excess current capacity) and worldwide Diaspora consumption in the five industries targeted.
Table 6. Comparison of potential Diaspora demand and Armenian supply in the main foodstuff industries
| Product | Excess current capacity ($mln) | Potential Diaspora Demand ($mln) | Demand Coverage Ration (%) |
|---|---|---|---|
| Beer | 28.9 | 137.6 | 21 |
| Wine | 4.76 | 252.9 | 1 |
| Cheese | 13.6 | 291.3 | 10 |
| Processed Fruit and Vegetables | 12.9 | 518.8 | 2 |
| Dried Fruit | 0.9 | 58.8 | 2 |
| TOTAL | 75.4 | 1,259.2 | 6 |
The demand coverage ration shows what proportion of worldwide Diaspora consumption of each product would have to be diverted to Armenian exports of these products to ensure that these industries operate at full capacity. The lower the demand ratio, the easier it should be to ensure that Diaspora demand fills the void left by domestic consumption. Simply stated, every Diasporan’s drinking one Armenian beer out of 100 will be sufficient consumption of Armenian beer to ensure that the beer industry is operating at full capacity to keep up with demand.
The cheese (and to some extent wine) industries might find it harder to attract enough Diasporan demand. The case of cheese may prove to be particularly difficult considering that cheese consumption per capita is quite low in Armenia’s largest national market, currently Russia. Of course, the key assumption here is that Diasporan Armenians in Russia, especially the large “new Diasporan” community consumes as little cheese as the average Russian. This is far from certain as per capita cheese consumption in Armenia currently is three times that in Russia, suggesting that Diasporan Armenians in Russia may naturally just consume more cheese than our basic demand function takes into account.
Moreover, the two Western markets, the USA and France, are difficult to break into because of the tough competition from other very sophisticated products from the demand point of view, as well as tough health requirements and high transport costs on the supply-side. What do the unique consumption preference characteristics of each national market and each Diaspora community forming these markets imply regarding the demand for exports of each product? In other words, which foreign markets would be the most attractive for each of these products?
How might these consumption patterns affect the composition of Armenia’s economy, its environment, Armenia’s reputation and place in the world economy, the welfare of its people in the long run? These questions, while beyond the scope of this paper, have perhaps the most fundamental significance for the long-run. In the meantime, this paper has sought to demonstrate that a focus on diasporan consumption has the short-term potential to bring substantial, sustainable economic growth and jobs to Armenia in the order of tens, if not, hundreds of millions of dollars per year, within Armenia’s existing production capacity, without significant risk or burden to the diaspora.
* ©Arak-29 Charitable Foundation, 2004.
This Paper was prepared by the Arak-29 Foundation, Yerevan, Armenia, under a grant from Birthright Armenia. The research team consisted of Artashes Tonoyan, Manuk Ghazanchian, Chris J. Uregian, and Thomas J. Samuelian.
[1] Study by Razmig Hovaghimian of the Cloverfield Group, July 2003. See Appendix 1 for relevant charts.
[2] http://wfhummel.enchost.com/multipliermyth.html
[3] Evgeny Polyakov, World Bank Working Paper No. 2593, “Changing Trade Patterns after Conflict Resolution in the South Caucasus” (April 2001). This is a modest estimate given that Beilock (1999) assumed an exports-to-GDP multiplier of 3.0 for Armenia.
[4] According to the RA Poverty Reduction Strategy, in 2001-2002, Armenia experienced 12% growth in GDP and 1.3% increase in employment, from which this ratio can be deduced
[5] According to the RA Poverty Reduction Strategy Paper, there are 800,000 currently employed in Armenia with an average monthly salary of $100, which results in a salary base of $80 million. Of the 800,000, approximately 250,000 are in the public sector.
[6] US Bureau of Labour Statistics, Consumer Expenditure Survey 2002.
[7] Based on US Federal Reserve Board figures for total US household net wealth in 2003.
[8] Based on IMF Balance of Payment Statistics Yearbook 2002.
[9] See Lev M. Freinkman, “Role of the Diasporas in Transition Economies: Lessons from Armenia”, paper presented at the 11th Annual Meeting of the Association for the Study of the Cuban Economy, Coral Gables, 2001.
[10] A. Gevorkyan and D. Grigorian, “Armenia and Its Diaspora: Is There a Scope for a Stronger Economic Link?” Working Paper No. 03/10, Armenian International Policy Research Group, 2003, p. 3.
[11] Ibid. p. 3.
[12]The efficacy of consumption as a driver of economic growth is closely associated with the Keynesian economic model.
[13] UNDP Armenia, “Education, Poverty and Economic Activity in Armenia: Situation Analysis Report 2002”, Section 6.
Armenian National Statistical Service, “Income and expenditure and food consumption of the population of RA in 2001”, Section 3, (2003).
[14] Hernando de Soto, The Mystery of Capital, (NY: Bantam Press, 2000), p. 26.
[15] The National Association of Realtors estimates the value of the multiplier of the US housing sector to be between 1.34-1.62 in the first year or two after an autonomous increase in spending.
[16] Within the framework of this project a model for these estimates has been developed. For more details on model see Appendix II.
[17] As noted above, the job creation effect of economic growth in Armenia is dampened by the fact that many Armenians are currently under-employed, so that increased demand is satisfied first by increasing the productivity of current job-holders and only later by new hires. In developed Western economies, many models predict an increase of 1% employment for each 1% increase in GDP.
* These figures represent export growth in 2001. The export growth rates for all the products listed above in 2002 will be available shortly.